Inside Pro
Real screens, live data — this is what the full board looks like.
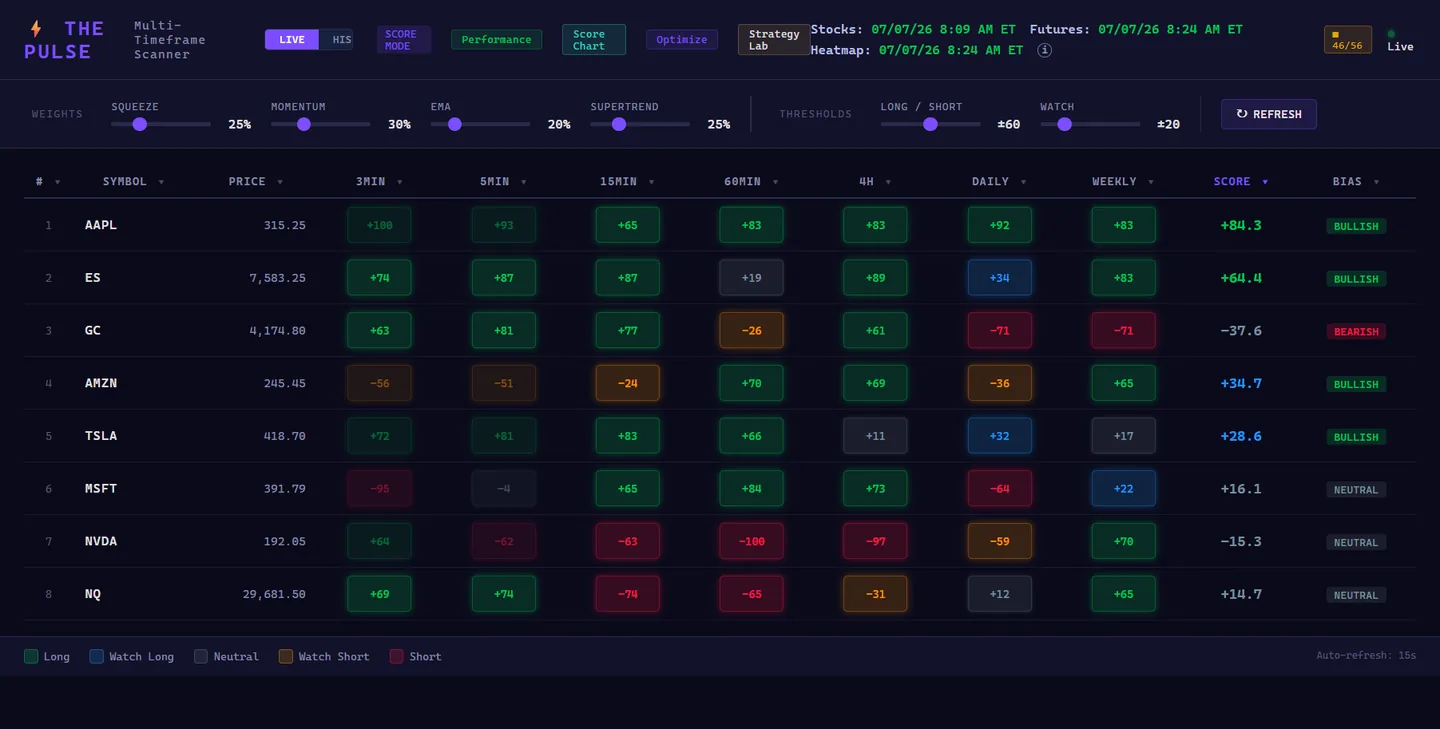
Custom weights PRO
Drag the Squeeze / Momentum / EMA / SuperTrend sliders and the whole board re-scores instantly — tune the composite to your strategy.
Historical replay PRO
Rewind the board to any past date and time. See exactly what the heatmap showed before the move — no hindsight bias.
Signal Performance Tracker PRO
Every signal the scanner ever fired, scored honestly — win rate, average move, and profit factor per symbol and timeframe.
Weight Optimizer PRO
Grid-search the entire weight space per symbol and rank every combination by profit factor — then apply the winner with one click.
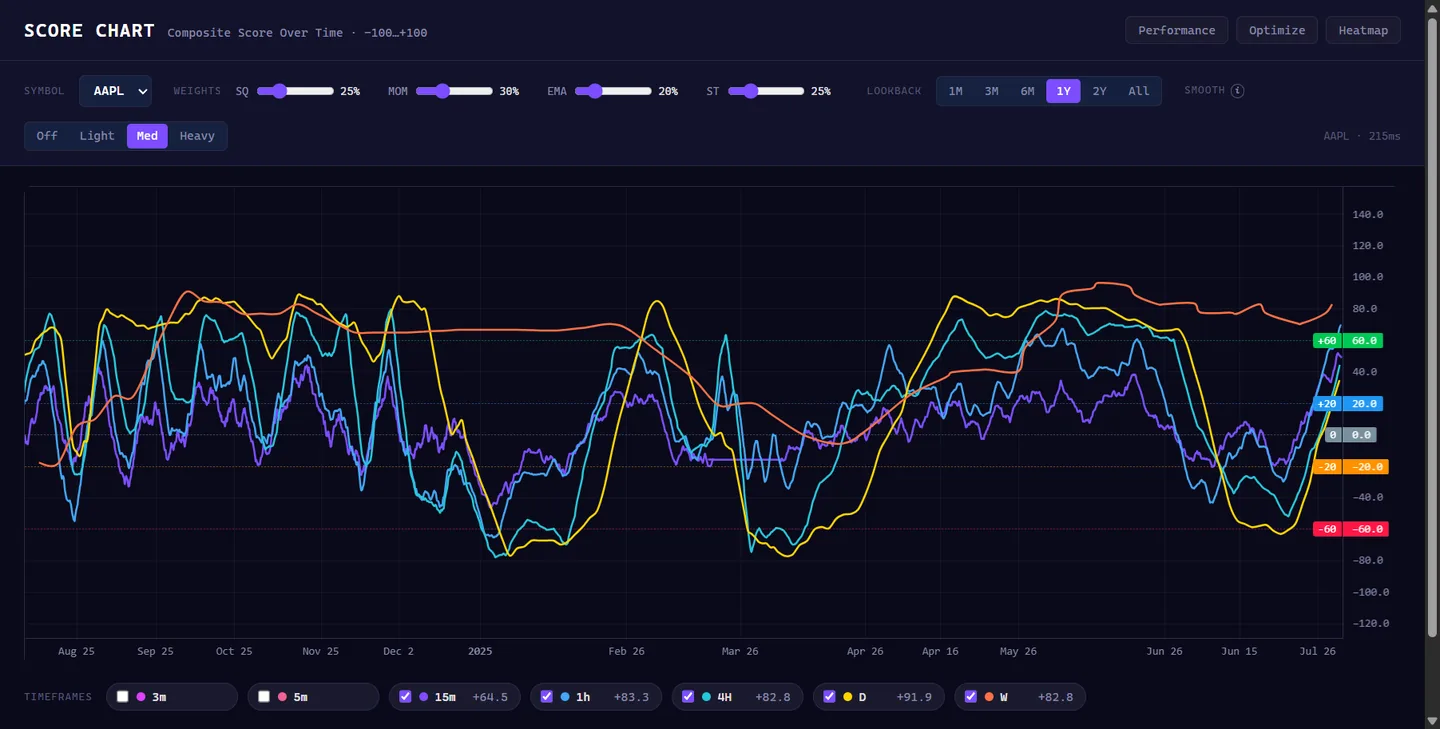
Score chart NEW
The composite score plotted over time, per timeframe, with adjustable smoothing — watch how the timeframes align before a move.